【Python×matplotlib×ChatGPT】ロマネスコ・ブロッコリーのようなフラクタルな図
こんにちは!
今回はロマネスコ・ブロッコーリーをpythonで描画してみます。
ロマネスコ・ブロッコリーとは・・・カリフラワーの一種みたいです。
私は実際に見たことも食べたこともありません。
図にすると、ブロッコリーみたいになるのかなと思い、面白そうなので試してみました。
ChatGPTとあれやこれやしていると、2通りの図ができました。
まずは、なんとなくブロッコリーに見える図1です。
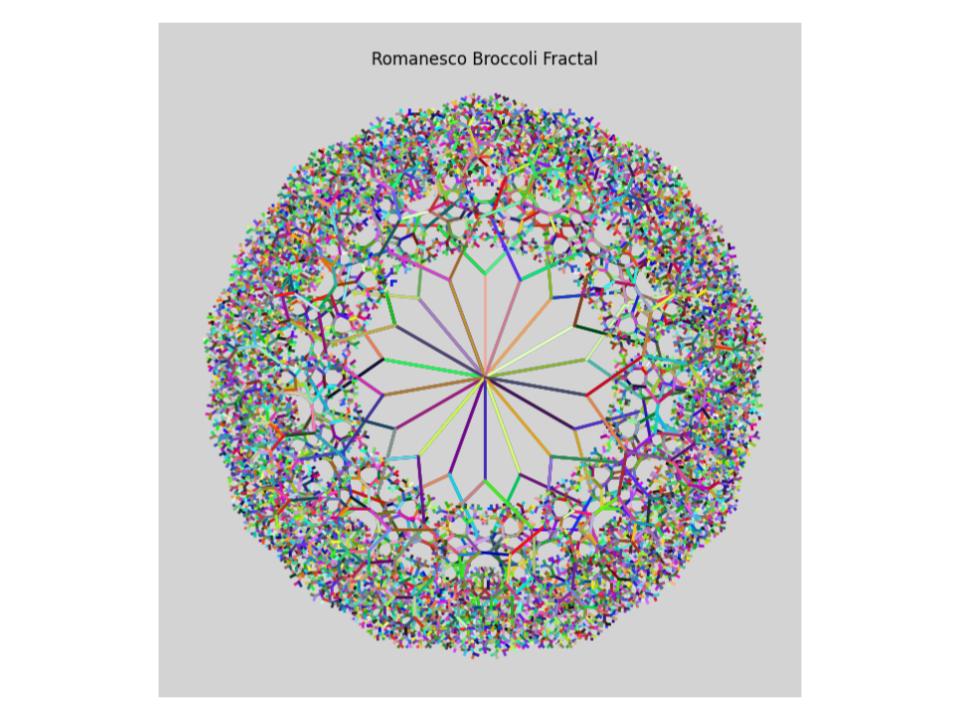
pythonコードです
import matplotlib.pyplot as plt
import numpy as np
import random
from matplotlib.colors import LinearSegmentedColormap

def draw_fractal(levels, size, base_angles):
    def draw_branch(x, y, angle, length, depth):
        if depth == 0:
            return
        x2 = x + length * np.cos(np.radians(angle))
        y2 = y + length * np.sin(np.radians(angle))
        cmap = generate_random_cmap()
        plt.plot([x, x2], [y, y2], color=cmap(random.random()), lw=2)
        draw_branch(x2, y2, angle - 45, length / 1.5, depth - 1)
        draw_branch(x2, y2, angle + 45, length / 1.5, depth - 1)

    # プロット領域の設定
    plt.figure(figsize=(8, 8), facecolor='lightgray')  # 背景色の変更
    plt.axes().set_aspect('equal', 'datalim')

    # 各レベルごとにフラクタルな形状を描画
    for level in range(1, levels + 1):
        angle_shift = 0 if level % 2 == 0 else 180 / len(base_angles)
        angles = base_angles + angle_shift
        for angle in angles:
            x, y = 0, 0
            draw_branch(x, y, angle, size, level)

    plt.axis('off')
    plt.title('Romanesco Broccoli Fractal')  # グラフタイトルの追加
    plt.show()

def generate_random_cmap():
    colors = [(random.random(), random.random(), random.random()) for _ in range(100)]
    cmap_name = f'random_cmap_{random.randint(0, 10000)}'
    return LinearSegmentedColormap.from_list(cmap_name, colors, N=100)

if __name__ == "__main__":
    # ロマネスコ・ブロッコリーの描画パラメータ
    levels = 10      # レベル数
    size = 100       # 描画領域のサイズ
    base_angles = np.array([30, 70, 110, 150, 190, 230, 270, 310, 350])

    draw_fractal(levels, size, base_angles)
なんとなくブロッコリーに見える図2です。

次にブロッコリーの芯?に見える図1です。
等高線みたいです。

ブロッコリーの芯?に見える図2です。

楽しめたのでブロッコリーはこれで終わりにします。